LuningCui,SiChen,YapingWang,LeiZhangandPengGao
(1. No. 92942 Unit of People"s Liberation Army of China, Beijing 100161, China; 2. School of Mechanical Engineering, Nanjing University of Science and Technology, Nanjing 210094, China; 3. Marine Design and Research Institute of China, Shanghai 200011, China; 4. School of Mechanical Engineering, Shenyang University of Technology, Shenyang 110780, China)
Abstract: Aiming at the mooring stability of the ship-borne vehicles and the safety of steel chain links under high sea condition, the rigid-flexible coupling dynamics model of deck-vehicle-mooring chain was established, the load characteristics of the mooring chain under class-9 sea state were obtained. The failure mode of the chain link and the influence law of the torsion angle on the stress distribution was obtained. Based on Miner"s linear cumulative damage theory, the fatigue life of the mooring chain link was analyzed using the corrected mooring link S-N curve. The existing safety hazards were pointed out. The optimization of the mooring scheme was proposed. The conclusions are as follows: 1) The mooring scheme can meet the mooring stability requirements of vehicles under high sea condition. 2) The failure mode on the outside of the link crown was mainly tensile failure, and the failure mode on the inside is mainly contact fatigue failure under compression. 3) The torsion angle had a significant effect on the stress situation of the chain link. When it exceeds 15 degrees, it will no longer meet the strength requirements. 4) Through the optimization of the mooring scheme, the fatigue life of the steel chain link has been significantly increased
Keywords: sea conditions; mooring; safety; strength; fatigue life
In the situation of sea transportation, shipborne vehicles are affected by complex sea conditions and ship movements. Especially under high sea conditions, the deck and the vehicle will be under the strong and complex dynamic loads. It is necessary to avoid the vehicle from slipping, rollover and the fatigue damage of the mooring chain. It ensured the safety of the vehicles and mooring facilities.
An amount of research has been published on the mooring of shipborne equipment. Refs. [1]-[4] analyze the mooring load and displacement of the shipborne aircraft, and optimize the mooring design. Refs. [5]-[6] analyze the movement of the shipborne vehicle and the load of the mooring rigging under different sea conditions. These studies focus on the mooring load, rather than the failure mode, fatigue life and safety of the mooring rigging. The mooring rigging are all steel wire. In this paper, due to the heavy weight of the vehicles, the steel chain was adopted. At present, no previous study has investigated the safety of the steel mooring chain.
Most studies in steel chain are currently focused on the field of mooring anchor. Refs. [7]-[16] analyze the influence law of the mooring anchor chain damage in the marine environment, the environmental adaptability and life of the mooring anchor chain, because the external load of the steel chain rigging for shipborne vehicles is much greater than the mooring anchor chain. The corrosion damage of the chain by seawater is lower than the mooring anchor chain. Therefore, it is necessary to study the fatigue life of the steel chain rigging.
In this paper, the stability of the shipborne vehicle and the fatigue life of the steel mooring chain were simulated under high sea conditions. The rigid-flexible coupling dynamics model of the deck-vehicle-mooring chain was established. The mooring stability under high sea conditions was analyzed. The load characteristics of the mooring chain were obtained. The strength failure mode and the stress distribution under different torsion angles of the steel mooring chain were analyzed. Based on the modified S-N curve of the mooring chain, the fatigue life was obtained by Miner"s linear cumulative damage theory. This paper proposed an optimized mooring scheme, and verified the optimized scheme.
1.1 Dynamics Simulation Model
The voyage of the ship on the sea is a complex motion with multiple degrees of freedom. The ship-borne vehicles is in a complex dynamic environment, especially under high conditions. Because the periodic roll, pitch, yaw, roll, pitch and heave of the hull, the vehicle is subjected to large impact loads in six degrees of freedom. The rolling, pitching, and heave motions are the key factors that affect the fatigue life of the vehicle mooring rigging[5]. The high sea condition in this paper is as follows: the class-9 seastate[17]45° wave direction angle at 18 kn speed (hereinafter referred to as class-9 sea state). The motion parameters of the ship obtained through experiments were as follows: roll angle 8.18°, pitch angle 4.67°, and heave 6.26 m. The rules of ship shaking and movement are as follows:
(1)
whereαis the rocking angle of the ship;ξis the displacement of the ship;Tαis the rocking period;Tξis the displacement period of the ship;a0is the rocking constant;ξ0is the displacement constant.
The rigid-flexible coupling dynamic model of deck-vehicle-mooring chain was established in ADAMS (Fig.1). The description of the model was as follows:

Fig.1 Simulation model of deck-vehicle-mooring chain
1)The crawler of the vehicle was considered as an integral part. The suspension system as a rigid body was connected to the wheel by a linear equivalent spring and damper. It vibrated at vertical and pitch. The interaction between the load wheel and the chassis was a spring damper.
2)The contact between the vehicle track and the ship deck was defined as rigid contact. The contact stiffness was 109N/m, the damping coefficient was 10, and the friction coefficient was 0.3 according to the wet deck.
3)The mooring rigging consists of mooring chain and the tension device. The mooring chain was modeled as discrete flexible connectors. The tension device was simulated by spring unit. The total mass of discrete flexible connectors was equal to the mooring chain.
4)The deck was a rigid body. The point driver with 3 degrees of freedom simulated the wave motion on the ship.
1.2 Mooring Stability
Fig.2 and Fig.3 show the displacement and angle curve of the vehicle relative to the deck at the class-9 sea state. The movement of the vehicle was periodic. The maximum sway amplitude was 13.6 mm, the maximum heave amplitude was 1.72 mm, the maximum surge amplitude was 6.6 mm, the maximum roll angle was 0.025 °, and the maximum pitch angle was 0.0362 °. The results were within the allowed range of vehicle stability requirement. There will be no danger of sideslip or roll over.

Fig.2 Relative displacement curve of car body

Fig.3 Relative roll angle curve of the car body
1.3 Load of Mooring Chain
Fig.4 shows the mooring chain layout plan and serial number of mooring chains.

Fig.4 Mooring chain arrangement
Fig.5 shows the load curves. The force amplitude of No. 1, 2, and 3 chains were larger. The peak force of each chain appeared at a different moment. The maximum force was 64.4 kN, which was less than the breaking load (200 kN) of the mooring chain.

Fig.5 Load curve of the mooring chain
In the whole life cycle of the mooring chain, the fatigue damage caused by the long-term cyclic load is a safety hazard. Therefore, this paper analyzes the fatigue life of the mooring chain link based on the “time-load history” obtained from the mooring stability analysis.
2.1 Static Strength of Mooring Chain Link
Because the stress of each link on the entire mooring chain was the same, one pair of links was modeled. Fig.6 shows the finite element model. The material of the mooring chain link was SAE8620D. The contact between chain links was defined as “universal contact” by asymmetric contact and augmented Lagrange algorithm. The contact surface adopted CONTA174. The target surface adopted TARGE170. The element type was SOLID186. The total number of elements was 144074. The left end face of chain link was fixed and the right end face was loaded. The loading position was the center of both end faces. The friction factor between two links was 0.1. The load was the maximum force from the dynamic analysis.

Fig.6 Chain model
Fig.7 shows the stress distribution. The maximum equivalent stresses of the mooring chain link concentrated on the crown. The stress distribution in high sea conditions was different from mooring anchor or in class-4 or 5 sea state which concentrates on the contact area of the crown[15]. Due to the strong dynamic load in class-9 sea state, the maximum equivalent stress concentrated outside the crown of the link. The maximum stress had exceeded the material"s yield stress of 785 MPa. The link entered the stage of plastic deformation. The maximum plastic strain reached 6.1%. The stress on the contact area inside the crown was 650 MPa, which did not exceed the allowable contact stress of the material.
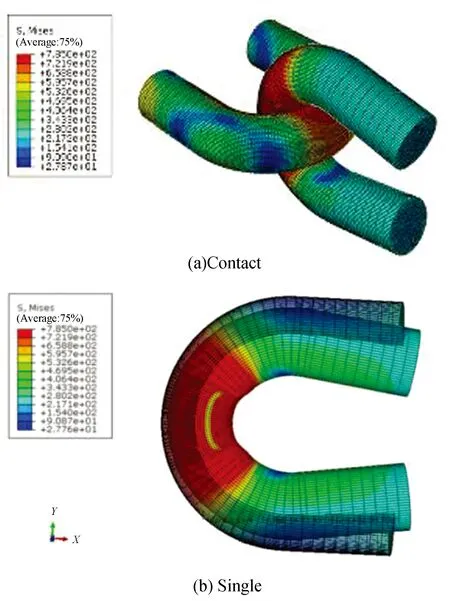
Fig.7 Stress distribution
Under the class-9 sea state, the failure mode on the outside of the chain crown was mainly tensile failure, and the failure mode on the inside was mainly contact fatigue failure under compression.

Fig.8 The finite element model after rotation
Fig.9 shows the stress distribution of the contact area of the chain link at various torsion angles. With the increase of torsion angle, the position of the contact point and the stress distribution changed. However, the maximum stress still occurred near the surface below the contact area. The torsion angle had greater influence on the stress of the inner contact area, but had less influence on the stress outside the link crown. When the torsion angle was equal to or greater than 15 °, the plastic strain reached the material limit and the link damaged.

Fig.9 Stress distribution in the contact area under various torsion angles
2.2 S-N Curve and Load Spectrum
According to the specification of DNV-OS-E301[17], the relationship between the number of fatigue cycles and the stress amplitude of the mooring chain ring can be expressed by the following formula:
nc(S)=aDS-m
(2)
wherencis the number of stress amplitude cycles;aDis the intercept of the S-N curve, which is 6.0 × 10¹⁰;mis the slope of the S-N curve, which is 3.0.
The mooring chain link was used in the cabin, which was different from the seawater immersion environment and corrosion status under the mooring condition in the DNV-OS-E301. The S-N curve was corrected by the following formula:
(3)
whereSais the modified chain link S-N curve stress;Sis the S-N curve stress in DNV;Kfis the fatigue notch coefficient, which is 4.59;εis the size coefficient, which is 0.7;βis the surface quality coefficient, which is 0.64- 0.33;CLis the loading method, which is 0.85.
Fig.10 shows the corrected S-N curve.

Fig.10 Corrected S-N curve of link
Based on the load-time history curve of the mooring chain, the rain-flow counting method was used to obtain the load spectrum on the chain link. Fig.11 shows the load spectrum of the chain link.
Now it was the bear s turn to be alarmed, and with a mighty growl15 he jumped down from the oak and fell right on the top of the wolf and killed him as dead as a stone

Fig.11 Load spectrum of the chain link
From Fig.11, the ratio of the real-time cyclic load to the maximum load is as the input of the rain-flow counting method. The mean value of the load was scattered in the whole ratio interval. The amplitude concentrated on two intervals:[0, 0.26] and [0.52, 1]. The load cycles with larger amplitude accounted for a small proportion, while the rest were load cycles with smaller amplitude.
2.3 Fatigue Life of Mooring Chain Link
Based on the fatigue cumulative damage theory, the fatigue life of the mooring chain link was analyzed. Fig.12 shows the fatigue life distribution. The minimum life area of the mooring chain link was located at the crown of the link, and the life was 104.379times. That is, fatigue failure occurred after 239 h of continuous use.

Fig.12 Fatigue distributing graph of chain link
3.1 Safety under Extreme Conditions
It did not cause strength damage in the normal state. When the mooring device was within the fatigue limit, the safety of vehicles can be guaranteed. However, due to material defects or some unpredictable conditions, the mooring chain may be accidentally broken. This paper analyzed the mooring safety of vehicles in the high case of accidental breakage of the mooring chain. Based on the dynamic model, a sensor was set for each mooring chain. When the force of the mooring chain exceeded 200 kN, the sensor was activated and the chain connection failed.
It is assumed that the mooring chain No.1 breaks in class-9 sea state. The result showed when the mooring chain No.1 failed, the force of the mooring chain No.5 and No.6 exceeded 200 kN after 4.5 s, then failed. The mooring chain No.2 failed after 11 s. The mooring chain No.3 and No.4 failed after 12 s. Fig.13 shows the state of the moored vehicle after all the mooring chain had failed. The vehicle had a large slippage on the deck only by friction.
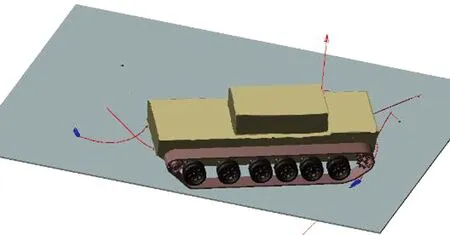
Fig.13 Vehicle movement state after the mooring chains fail
3.2 Optimized Mooring Scheme
In order to enhance the safety guarantee for the vehicles mooring, the mooring scheme was optimized. Through the mooring stability simulation, the lateral displacement of the ship-borne vehicle relative to the deck was relatively large, and the difference was obvious in the load amplitude of each mooring chain. Due to the limitation of the lateral space in the cabin, the width of the new mooring point should be smaller than the original mooring point. The location should be near the center of mass. Fig.14 shows the optimized mooring scheme.

Fig.14 The optimized mooring scheme
3.3 Comparison of Mooring Stability
In the case of mooring chain No.1 failure, the loads on other mooring chains were less than the breaking load. The failure did not occur. Table 1 shows the maximum load of each chain, among which No.7 and No.8 were new mooring chains.

Table 1 Maximum force of mooring chain
The optimized mooring scheme can not only effectively deal with emergencies under extreme conditions, but also improve the mooring stability and reduce the force of mooring chains under normal conditions. Compared with the original mooring scheme, the lateral displacement of the vehicle and the load of the mooring chain were significantly reduced (Table 2 and Table 3) in the optimized scheme. The maximum load of the mooring chain was reduced to 41.3 kN, which was 36% less than the original mooring scheme.

Table 2 Comparison of relative displacement of the vehicle body

Table 3 Comparison of maximum load of mooring chain
3.4 Comparison of Fatigue Life
Fig.15 shows the stress and strain distributing graphs. Compared with the original scheme, the chain link still entered the stage of plastic deformation, and the weak parts were still located outside the crown of the chain link and the contact site. The maximum plastic strain reached 5.3%, which was 13% less than the original scheme.

Fig.15 Stress and strain distribution after optimization
Fig.16 shows the fatigue life distribution.The minimum fatigue life still occurred in the contact area of the link crown. The minimum fatigue life was 105.146time. That is, it could be used continuously for 1392 h, which was 4.8 times higher than that of the original mooring scheme.

Fig.16 Fatigue distribution of chain link
By the rigid-flexible coupled dynamics simulation combined with strength and fatigue life methods, the mooring reliability and safety of mooring chains under high sea conditions was analyzed. The following conclusions were obtained:
1) The original mooring scheme can meet the mooring stability requirements of vehicles under high sea conditions;
2) The failure mode on the outside of the link crown was mainly tensile failure, and the failure mode on the inside is mainly contact fatigue failure under compression;
3) The torsion angle had a significant effect on the load of the chain link, and it will no longer meet the strength requirements when it exceeds 15°;
4) By optimizing the mooring point, the fatigue life of the mooring chain link can be significantly increased.
In addition, this paper only considered the way of increasing the mooring point when optimizing the mooring scheme. The position and layout of the deck can also be considered comprehensively to optimize the angle and position of the mooring chain without increasing the mooring point.
推荐访问:optimization Analysis safety