Xin-e He , Xue-min Wu , Lei Wn Qin-yon Lin *, Li-jun Gu Fei Liu,Hi-lon Lu Yi Zhn , Min Zhn *
a Beijing International Center for Gas Hydrate, Peking University, Beijing 100871, China
b Guangzhou Marine Geological Survey, China Geological Survey, Ministry of Natural Resources, Guangzhou 510075, China
c School of Earth and Space Sciences, Peking University, Beijing 100871, China
d Dongguan Institute of Optics and Electronics, Peking University, Dongguan 523000, China
e Southern Marine Science and Engineering Guangdong Laboratory (Guangzhou), Guangzhou 511458, China
f School of Computer and Communication Engineering, University of Science and Technology Beijing, Beijing 100083, China
g SinoProbe Center, Chinese Academy of Geological Sciences and China Geological Survey, Ministry of Natural Resources, Beijing 100037, China
1 Both authors contributed equally to the paper
Keywords:
Gas hydrate production monitoring
Optical fiber sensor
Distributed acoustic sensor
In situ monitoring
Fluid type
NGHs exploration trial engineering
Oil and gas exploration engineering
Shenhu Area
South China Sea
A B S T R A C T
The distributed acoustic sensor (DAS) uses a single optical cable as the sensing unit, which can capture the acoustic and vibration signals along the optical cable in real-time.So it is suitable for monitoring downhole production activities in the process of oil and gas development.The authors applied the DAS system in a gas production well in the South China Sea for in situ monitoring of the whole wellbore for the first time and obtained the distributed acoustic signals along the whole wellbore.These signals can clearly distinguish the vertical section, curve section, and horizontal production section.The collected acoustic signal with the frequency of approximately 50 Hz caused by the electric submersible pump exhibit a signal-to-noise ratio higher than 27 dB.By analyzing the acoustic signals in the production section, it can be located the layers with high gas production rates.Once an accurate physical model is built in the future,the gas production profile will be obtained.In addition, the DAS system can track the trajectory of downhole tools in the wellbore to guide the operation.Through the velocity analysis of the typical signals,the type of fluids in the wellbore can be distinguished.The successful application of the system provides a promising whole wellbore acoustic monitoring tool for the production of marine gas hydrate, with a good application prospect.
Oil and gas are the most important primary energy (Wu K,2014).In addition to the continental oil and gas fields, the ocean also contains rich oil and gas resources, among which a typical representative is natural gas hydrates (NGHs).NGHs is a substance in which the molecules of gas and water chemically interact to form an icelike crystalline structure under relatively low temperature and high pressure (Xu WY and Ruppel C, 1999; Dickens GR, 2001; Bhatnagar G et al.,2007; Sloan ED et al., 2010; Zhang JH et al., 2018; Ma GZ et al., 2020).NGHs is widely distributed in the marine continental margin and the permafrost zone, and the conservative estimates of its energy reserves are higher than the total amount of proven fossil fuels, so it is considered as a promising unconventional energy resource (Zhang HT et al.,2007; Konno Y et al., 2017; Zhao XM et al., 2018; Yu XH et al., 2019; Lu ZQ et al., 2020).Since 1998, the United States,Canada, Japan, and China have carried out a large number of scientific research and drilling experiments in the Mallik drill site, in Alaska on the Alaska North Slope, Nankai Trough,and South China Sea (Collett TS et al., 2009; Uddin M et al.,2014; Fujii T et al., 2015; Yu T et al., 2019; Chen Q et al.,2020).In 2017 and 2020, China achieved two trial production of gas hydrate in the South China Sea.It has created two world records of cumulative gas production and daily gas production and realized a major leap from exploratory production to trial production (Li JF et al., 2018; Zhang RW et al., 2018; Ye JL et al., 2020).The gas hydrate pilot production area, with a water depth range of 1000-1300 m, is located in the middle of the continental slope of the southeast Shenhu Area in the South China Sea, and tectonically belongs to the Baiyun Sag of the Zhuer depression in the Pearl River Estuary Basin.The gas hydrates are mainly developed in the Quarternary natural levees and distributed in the pores of loose sediments in the form of infection.The reservoir mainly consists of argillaceous silt and silty mud and are characterized by single lithology, small grain size (average medium grain size: 6-8 μm), and high content of clay (Zhang HQ et al., 2007; Wang XJ et al., 2014; Yang SX et al., 2015;Fang YX et al., 2019; Qin XW et al., 2020; Su PB et al.,2021; Zhang XD er al., 2021).
Although great progress has been made in the development of marine gas and oil production (Chee S et al.,2014; Kanno T et al., 2014; Yamamoto K et al., 2017; Liu LL er al., 2021), people barely know anything about the production behaviors like the fluid migration and sand production owing to lack ofinsitumonitoring instruments(Fu Q et al., 2015).Implementinginsitumonitoring,especially in the production well, is very challenging from an engineering perspective.The working condition for the instrument is very demanding since, in the downhole, there is not enough space for large instruments and its deployment should be as simple as possible to lower the engineering cost and operating time.However, the information underneath the sea bottom during the production process is critical for production strategy optimization and safety management.Distributed acoustic sensor (DAS) based on the Rayleigh backscattering to measure the strain changes that occurred along an optical fiber cable in real-time is ideal for downhole monitoring with compact size and simple instrumentation(Zhu GQ and Wang XJ, 2014; Cai HW et al., 2018, 2020; Feo G et al., 2020; He ZY and Liu QW, 2021).The sensing cable including thousands of sensing channels can be directly sent into the wellbore through coiled tubing or clamped on the casing of the wellbore to collect the acoustic signals in the whole wellbore (Wuestefeld A and Wilks M, 2019; Vahabi N et al., 2020).
In recent ten years, DAS technology has gone through rapid development and extended to various applications,primarily in the oil and gas industry (Parker T et al., 2014).DAS can pick up the waveform information of all acoustic signals along with the optical fiber without additional complex structure, including amplitude, phase, and frequency.Due to the all-fiber signal acquisition, DAS can customize the acquisition interval according to application requirements to achieve up to 1 m spatial resolution in reservoir detection without increasing the sensor density.Moreover, the sensing cable can be produced on an industrial scale with good longterm stability, which greatly reduces manufacturing costs.The maintainability and interchangeability of optical cables have been greatly improved, so the engineering cost can also be greatly controlled.Due to the great application potential of DAS technology, the international oil field service companies such as Weatherford, Schlumberger as well as the BGP Inc.China national petroleum corporation, with technical support from some professional optical instrument companies, have carried out several DAS application trials based on a single optical cable in the onshore oilfield, including vertical seismic profile (VSP) (Mateeva A et al., 2014; Daley TM et al., 2016;Li YP et al., 2020; Zhao F et al., 2022), micro-seismic monitoring (Li M et al., 2015), hydraulic fracturing monitoring (Richter P et al., 2019), and flow rate monitoring(Vahabi N et al., 2019).
By combining heterodyne modulation and demodulation technology with Rayleigh backscattering, the authors’ team realized a high definition distributed acoustic sensing (HDDAS) system, which can not only detect multi-point vibration but also obtain the real waveform of each vibration point (He XG et al., 2017, 2018).The noise floor of this system can reach below −80 dB re rad/√Hz, which is equivalent to that of the point sensor.The dynamic range of the system is higher than 100 dB, which can directly recover the music signal (He XG et al., 2020), showing excellent performance.
The HD-DAS system was applied in the production process of a gas well in the South China Sea, which is the first attempt in this application in the world.Since HD-DAS can monitor the position, time difference, phase, and energy of the acoustic signal caused by engineering events or fluid migration in the well, to identify and estimate the engineering effect, fluid type, and flow state in the wellbore.The sensing fiber in the HD-DAS system was deployed in the horizontal well and the interrogator in the instrument room can obtain the acoustic signals in real-time during the whole production.This application verified the performance of the selfdeveloped HD-DAS system and extends the DAS technology towards this new area of gas exploitation.
Fig.1 shows the structure of the high definition distributed acoustic sensing (HD-DAS) system based on the self-coherence heterodyne modulation and demodulation technology.A heterodyne pulse pair is generated by the optical signal modulation module.The frequencies of the two pulses aref1andf2respectively, so the heterodyne frequency is Δf=f1-f2.Firstly, the pulse pair is amplified by an erbiumdoped fiber amplifier (EDFA) and then injected into the sensing fiber through the circulator.The Rayleigh backscattered light in the fiber passes through the circulator to the signal detection module, and then the heterodyne algorithm is used to demodulate the optical phase change caused by the external acoustic field.There is no need for Rayleigh scattering to interfere with local light.The light scattered by two pulses will interfere with each other to realize the self-coherence effect.The phase change caused by the external acoustic field is modulated to the heterodyne frequency, and the high-precision phase signal can be obtained by the heterodyne demodulation algorithm.In addition, since the two pulses experience the same noise environment, the system can obtain a very low noise floor.
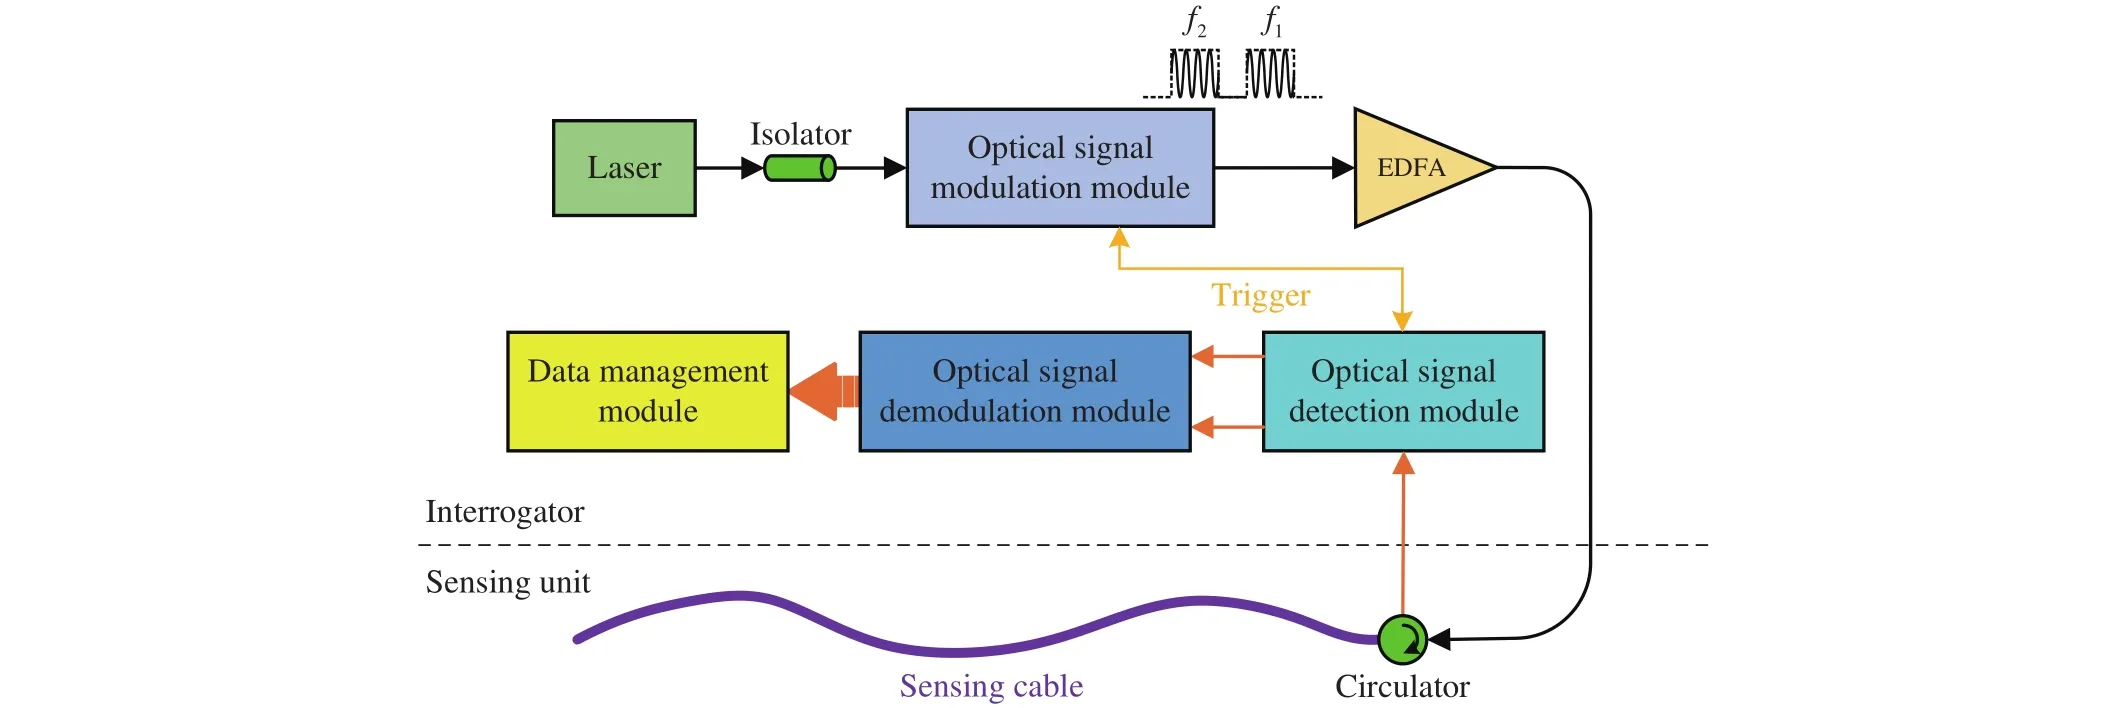
Fig.1.The structure diagram of the HD-DAS system.
Fig.2 shows the HD-DAS interrogator.The HD-DAS system is a passive acoustic sensing system with high density,high precision, high fidelity, and full-time.It can monitor the position, time difference, phase, and energy of the acoustic signal caused by engineering events or fluid migration in the well in real-time, to identify and judge the engineering effect,fluid type, and flow state in the wellbore.The system can be called a “Downhole Stethoscope”.The specific characteristics of the system can be summarized as follows:
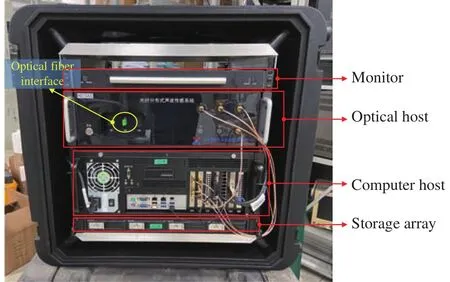
Fig.2.The HD-DAS interrogator.
● Full well section (up to 2500 m)
● High density (1 m/monitoring point)
● High precision (noise floor -80 dB re rad/√Hz@1kHz,equivalent to traditional point sensor)
● High fidelity (dynamic range>100 dB, broadband 0-2000 Hz)
● Full-time (7×24 hours)
● Passive (without sound source)
The technical specifications of the HD-DAS system are given in Table 1.There is a tradeoff between the heterodyne frequency Δfand the maximum sensing distanceLvia the relationship 4ΔfL≤c/(2n) wherecis the speed of light in vacuum andnis the effective refractive index of optical fiber(He XG et al., 2017).For the marine natural gas hydrate application, the heterodyne frequency has been specifically optimized to 10 kHz so that the maximum sensing distance can reach 2500 m to realize the monitoring of the full well section.
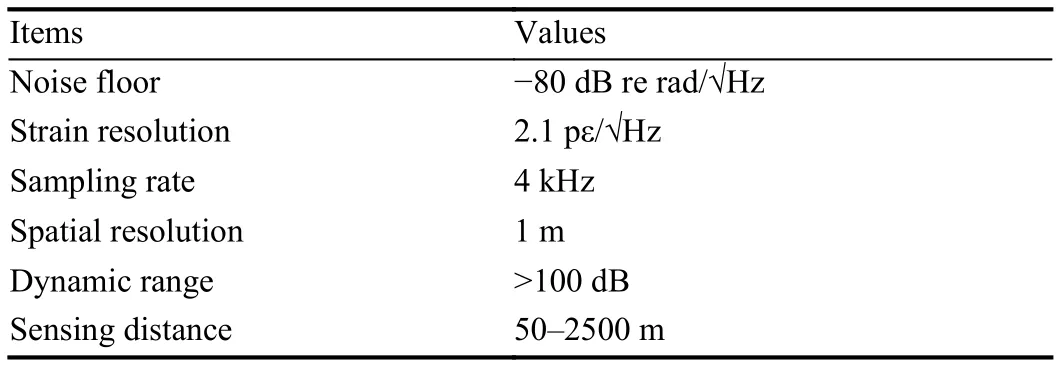
Table 1.The technical specifications of the HD-DAS system.
The relationship between the phase changeφ(unit of rad)and the strain changeτ(unit of pε) of the HD-DAS system can be expressed as:
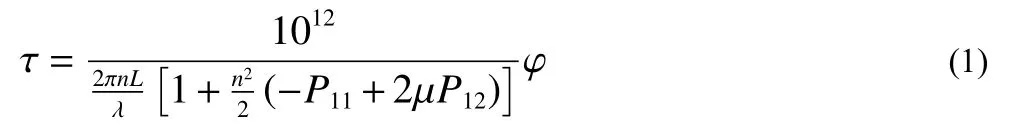
wheren= 1.5 is the effective refractive index of optical fiber,L= 8 m is the gauge length,λ= 1550 nm is the wavelength,P11= 0.121 andP12= 0.270 are the elastic-optic constants,μ=0.17 is the Poisson’s ratio.Therefore, the relationship between the phase change and the strain change isτ= 2.1×10⁴φ.
3.1.The characteristics of acoustic signal of the whole wellbore
The wellbore structure of the production well is a horizontal well and the sensing optical cable used for monitoring was tightly attached to the production string with clamps.Fig.3 shows the 2D time-domain waterfall plot of the whole wellbore acoustic signal obtained by the HD-DAS system, in which the horizontal axis is time, the vertical axis is measured depth, and different colors represent the amplitude of the signal.It can be seen that the signal is mainly divided into three sections: Seawater section, curve section,and horizontal production section.

Fig.3.Acoustic signal of the whole wellbore.
The curve section is mainly affected by the working vibration of the electric submersible pump (ESP), and the signal amplitude is very high.The signal in this section is shown in Fig.4a with its power spectral density (PSD) shown in Fig.4b.It can be clearly seen from the figure that the frequency of the signal caused by the ESP is 52.12 Hz with a PSD of 27.61 dB rad2/Hz, which is about 27 dB higher than the noise floor indicating the excellent performance of the HD-DAS system.Figs.4c, d show the time domain signal,and its PSD at the upper part of the curve section.It can be seen that there is an obvious 4.52 Hz low-frequency vibration signal.Combined with the whole wellbore acoustic signal, the 4.52 Hz vibration signal extends the first half of the curve section.It is speculated that this vibration signal is caused by the resonance of some structures in the string under the vibration of the ESP.
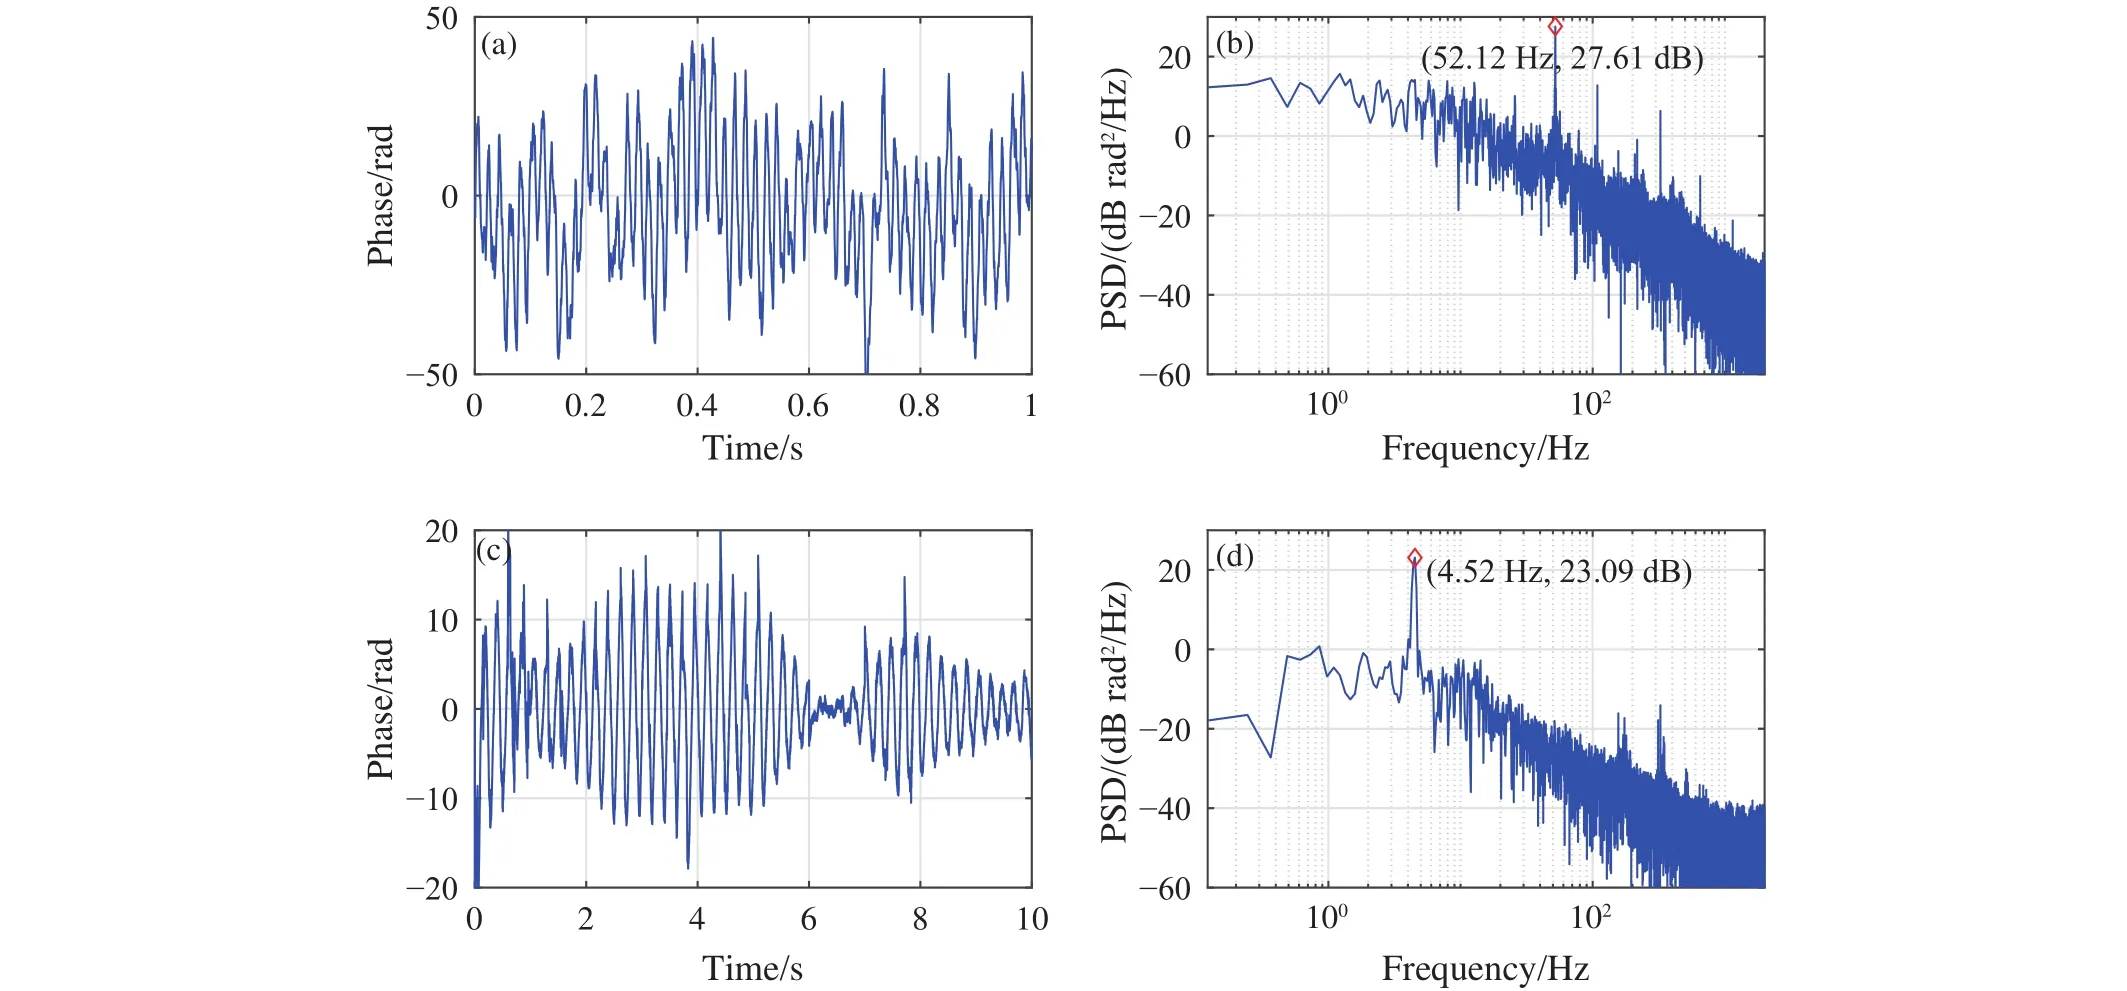
Fig.4.Acoustic signals at different positions.a-time-domain signal at curve section with (b) its power spectral density (PSD).c-time-domain signal at the upper part of the curved section with (d) its PSD.
3.2.Response of HD-DAS system to gas production
Fig.5 shows the 2D time-domain waterfall plot and PSD of the acoustic signal in the horizontal production section.It can be seen that the signal intensity of this section is weaker than that of the seawater section and the curve section.However, there are still obvious acoustic signals at certain positions.These signals exist all the time, and the frequency spectrum is mainly concentrated in the range of 5-20 Hz.It can be determined that these signals are mainly formed by continuous gas production in this section.The gas production can be obtained by measuring these acoustic signals in different layers.Combined with the distributed detection characteristics of the HD-DAS system, the gas production profile of the whole production section can be obtained.It should be noted that there are some false horizontal lines in Fig.5a.This is caused by the interference fading of the DAS system.For details, please refer to He XG et al., (2020).While there is no corresponding relationship between gas production and the acoustic signal at present, it is necessary to build a physical model in the laboratory in the future.Through the physical model to mimic the production process, the relationship between the amplitude, frequency, energy,dispersion, and other characteristics of acoustic signal and gas production behavior can be established, thus the gas production profile can be obtained with the collected acoustic signal data.
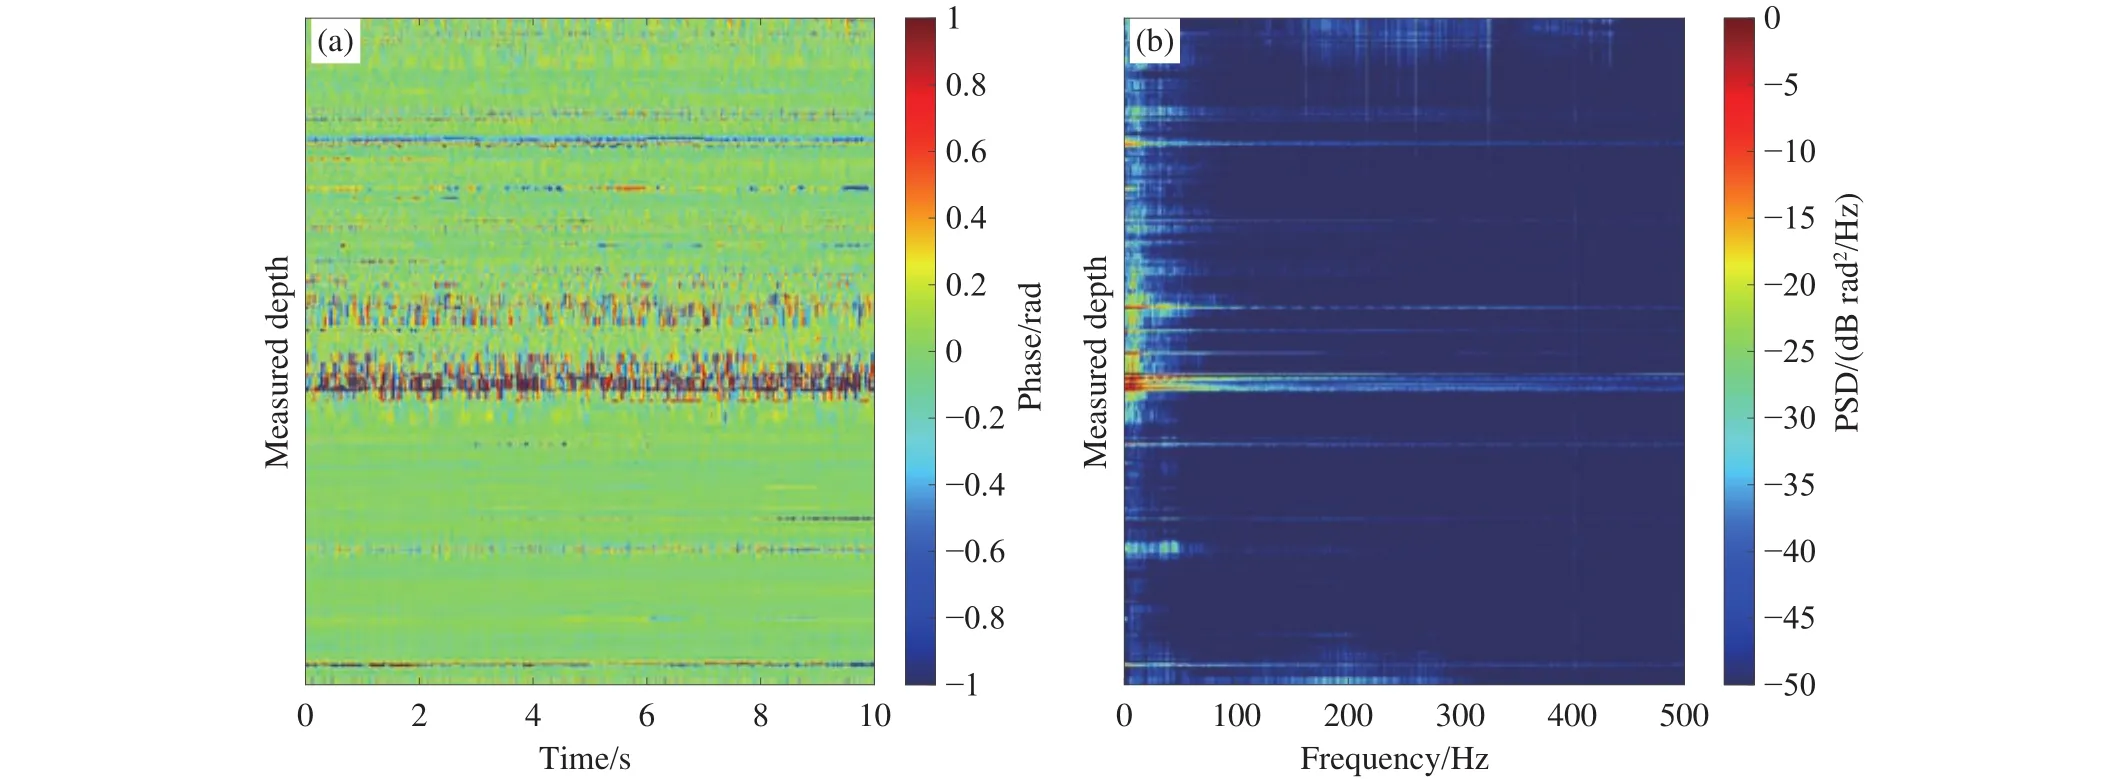
Fig.5.Acoustic signals in the horizontal production section.a-2D time-domain waterfall plot; b-PSD plot.
3.3.Response of HD-DAS system to engineering events
In the production, the coiled tubing was deployed in the production well section and pulled out after a short while for practical purposes.This activity was continuously monitored and the power plot of the signal correspondingly is shown in Fig.6.The power is obtained by calculating the sum of squares of 10 s acoustic signal.This event lasted an hour and 17 minutes from 09:50 am to 11:07 am.In the figure, the horizontal axis indicates time, the vertical axis is the measurement depth, and different colors represent different power intensity.
There appear evident acoustic propagation features in Fig.6 which is caused by the front end movement of the coiled tubing.Thus, the position of the front end of the coiled tubing can be clearly judged by this signal.It can be seen from Fig.6 that the front end of the coiled tubing enters the production well section at about 10:17 am, and then goes down to the deepest position at about 10:35 am.Then the coiled tubing was pulled out at about 10:55 am until out of the production well.These signal responses are in good agreement with the site operation log, which shows that the HD-DAS system can monitor the acoustic signals induced by downhole engineering events and estimate their effects to improve the operation strategy.
3.4.Identification of fluid types in the wellbore
As is known, the acoustic wave has different propagation velocities in different media, such as 4000 m/s in metal, 1400 m/s in water, and 340 m/s in air.HD-DAS system can recover all the signals with different propagation velocities, thus the fluid types in the wellbore can be distinguished according to the propagation velocity.
As illustrated in Fig.3, multiple acoustic signals were acquired in the seawater section, which is mainly produced by the impact of the sensing optical cable on the wellbore.The signals are further analyzed in Fig.7.
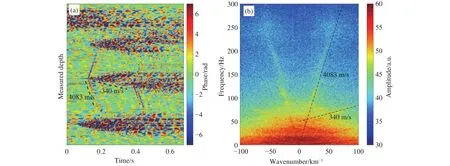
Fig.7.Typical signals in seawater section.a-2D time-domain waterfall plot; b-frequency-wavenumber spectrum.
It can be seen from Fig.7a that signals with two different propagation velocities are identified.Among them, the signal with 4083 m/s velocity transmits and decays rapidly.This velocity corresponds to the acoustic signal propagating in metal, which is the metal tube.In addition, the other signal with a propagation velocity of 340 m/s transmits and decays slowly, resulting in a long tail.This signal represents acoustic waves traveling in gas, and it can be determined that the main filled fluid in this section is gas.Fig.7b shows the frequencywavenumber spectrum of the signal, from which two propagation velocities of 340 m/s and 4083 m/s can be clearly seen, which verifies the above speculations.Through the above analysis, it is further confirmed that the fluid type in the wellbore can be well identified by using this method.
For the first time, the authors applied the optical fiber distributed acoustic sensor system to theinsituacoustic monitoring of marine gas production wells and obtained acoustic signals of the whole wellbore.These signals can clearly recover the impact, gas production, ESP operation,coiled tubing movement, and so on.The following conclusions can be drawn:
(i) The results show that the acoustic signal has an obvious response to the production, and once the relationship between the acoustic signal and the production is established by the physical model in the future, the gas production profile in the production section can be obtained.
(ii) The acoustic signal can clearly indicate the engineering events in the wellbore and then guide the operation during the production process.
(iii) According to the propagation velocity of the acoustic signal, the type of fluid in the wellbore can be identified.
CRediT authorship contribution statement
Xiang-ge He, Qian-yong Liang, Hai-long Lu, and Min Zhang conceived of the presented idea.Xiang-ge He, Xuemin Wu, Lei Wang, and Min Zhang carried out the experiment.Xiang-ge He wrote the manuscript with support from Xue-min Wu.All authors discussed the results and contributed to the final manuscript.
Declaration of competing interest
The authors declare no conflicts of interest.
Acknowledgment
This work was jointly supported by the Science and Technology Program of Guangzhou (202103040003), the offshore NGHs production test projects under the Marine Geological Survey Program initiated by the China Geological Survey (DD20190226, DD20190218 and DD20221706), the Key Program of Marine Economy Development Special Foundation of Department of Natural Resources of Guangdong Province (GDNRC [2020] 045), the financial support from China Geological Survey (DD20221703) and the National Natural Science Foundation of China (NSFC)(6210030553).